Showing posts with label hadoop. Show all posts

Friday, 29 May 2015

Don't fill your HDFS disks (upgrading to CDH 5.4.2)

Just a short post on the dangers of filling your HDFS disks. It's a warning you'll hear at conferences and in best practices blog posts like this one, but usually with only a vague consequence of "bad things will happen". We upgraded from CDH 5.2.0 to CDH 5.4.2 this past weekend and learned the hard way: bad things will happen.

The Machine Configuration

The upgrade went fine in our dev cluster (which has almost no data in HDFS) so we weren't expecting problems in production. Our production cluster is of course slightly different than our (much smaller) dev cluster. In production we have 3 masters, where one holds the NameNode and another holds the SecondaryNameNode (we're not yet using a High Availability setup, but it's in the plan). We have 12 DataNodes where each one has 13 disks dedicated to HDFS storage: 12 are 1TB and one is 512GB. They are formatted with 0% reserved blocks for root. The machines are evenly split into two racks.

Pre Upgrade Status

We were at about 75% total HDFS usage with only a few percent difference between machines. We were configured to use Round Robin block placement (dfs.datanode.fsdataset.volume.choosing.policy) with 10GB reserved for non-hdfs use (dfs.datanode.du.reserved), which are the defaults in CDH manager. Each of the 1TB disks was around 700GB used (of 932GB usable), and the 512 GB disks were all at their limit: 456GB used (of 466GB usable). That left only the configured 10GB free for non-hdfs use on the small disks. Our disks are mounted in the pattern /mnt/disk_a, /mnt/disk_b and so on, with /mnt/disk_m as the small disk. We're using the free version of CDHM so we can't do rolling upgrades, meaning this upgrade would bringing everything down. And because our cluster is getting full (> 80% usage is another rumoured "bad things" threshold) we have reduced one class of data (user's occurrence downloads) to a replication factor of 2 (from the default of 3). This is considered somewhere between naughty and criminal, and you'll see why below.

Upgrade Time

We followed the recommended procedure and did the oozie, hive, and CDH manager backups, downloaded the latest parcels, and pressed the big Update button. Everything appeared to be going fine until HDFS tried to start up again, where the symptom was that it was taking a really long time (several minutes, after which the CDHM upgrade process finally gave up saying the DataNodes weren't making contact). Looking at the NameNode logs we see that it was performing a "Block Pool Upgrade", which took btw 90 and 120 seconds for each of our ~700GB disks. Here's an excerpt of where it worked without problems:


2015-05-23 20:18:53,715 INFO org.apache.hadoop.hdfs.server.common.Storage: Lock on /mnt/disk_a/dfs/dn/in_use.lock acquired by nodename 27117@c4n1.gbif.org
2015-05-23 20:18:53,811 INFO org.apache.hadoop.hdfs.server.common.Storage: Analyzing storage directories for bpid BP-2033573672-130.226.238.178-1367832131535
2015-05-23 20:18:53,811 INFO org.apache.hadoop.hdfs.server.common.Storage: Locking is disabled for /mnt/disk_a/dfs/dn/current/BP-2033573672-130.226.238.178-1367832131535
2015-05-23 20:18:53,823 INFO org.apache.hadoop.hdfs.server.common.Storage: Upgrading block pool storage directory /mnt/disk_a/dfs/dn/current/BP-2033573672-130.226.238.178-1367832131535.
   old LV = -56; old CTime = 1416737045694.
   new LV = -56; new CTime = 1432405112136
2015-05-23 20:20:33,565 INFO org.apache.hadoop.hdfs.server.common.Storage: HardLinkStats: 59768 Directories, including 53157 Empty Directories, 0 single Link operations, 6611 multi-Link operations, linking 22536 files, total 22536 linkable files.  Also physically copied 0 other files.
2015-05-23 20:20:33,609 INFO org.apache.hadoop.hdfs.server.common.Storage: Upgrade of block pool BP-2033573672-130.226.238.178-1367832131535 at /mnt/disk_a/dfs/dn/current/BP-2033573672-130.226.238.178-1367832131535 is complete

That upgrade time happens sequentially for each disk, so even the though the machines were upgrading in parallel, we were still looking at ~30 minutes of downtime for the whole cluster. As if that wasn't sufficiently worrying, then we finally get to disk_m, our nearly full 512G disk:


2015-05-23 20:53:05,814 INFO org.apache.hadoop.hdfs.server.common.Storage: Lock on /mnt/disk_m/dfs/dn/in_use.lock acquired by nodename 12424@c4n1.gbif.org
2015-05-23 20:53:05,869 INFO org.apache.hadoop.hdfs.server.common.Storage: Analyzing storage directories for bpid BP-2033573672-130.226.238.178-1367832131535
2015-05-23 20:53:05,870 INFO org.apache.hadoop.hdfs.server.common.Storage: Locking is disabled for /mnt/disk_m/
dfs/dn/current/BP-2033573672-130.226.238.178-1367832131535
2015-05-23 20:53:05,886 INFO org.apache.hadoop.hdfs.server.common.Storage: Upgrading block pool storage directory /mnt/disk_m/
dfs/dn/current/BP-2033573672-130.226.238.178-1367832131535.
   old LV = -56; old CTime = 1416737045694.
   new LV = -56; new CTime = 1432405112136
2015-05-23 20:54:12,469 WARN org.apache.hadoop.hdfs.server.common.Storage: Failed to analyze storage directories for block pool BP-2033573672-130.226.238.178-1367832131535
java.io.IOException: Cannot create directory /mnt/disk_m/
dfs/dn/current/BP-2033573672-130.226.238.178-1367832131535/current/finalized/subdir91/subdir168
        at org.apache.hadoop.hdfs.server.datanode.DataStorage.linkBlocksHelper(DataStorage.java:1259)
        at org.apache.hadoop.hdfs.server.datanode.DataStorage.linkBlocksHelper(DataStorage.java:1296)
        at org.apache.hadoop.hdfs.server.datanode.DataStorage.linkBlocksHelper(DataStorage.java:1296)
        at org.apache.hadoop.hdfs.server.datanode.DataStorage.linkBlocks(DataStorage.java:1023)
        at org.apache.hadoop.hdfs.server.datanode.BlockPoolSliceStorage.linkAllBlocks(BlockPoolSliceStorage.java:647)
        at org.apache.hadoop.hdfs.server.datanode.BlockPoolSliceStorage.doUpgrade(BlockPoolSliceStorage.java:456)
        at org.apache.hadoop.hdfs.server.datanode.BlockPoolSliceStorage.doTransition(BlockPoolSliceStorage.java:390)
        at org.apache.hadoop.hdfs.server.datanode.BlockPoolSliceStorage.loadStorageDirectory(BlockPoolSliceStorage.java:171)
        at org.apache.hadoop.hdfs.server.datanode.BlockPoolSliceStorage.loadBpStorageDirectories(BlockPoolSliceStorage.java:214)
        at org.apache.hadoop.hdfs.server.datanode.BlockPoolSliceStorage.recoverTransitionRead(BlockPoolSliceStorage.java:242)
        at org.apache.hadoop.hdfs.server.datanode.DataStorage.addStorageLocations(DataStorage.java:396)
        at org.apache.hadoop.hdfs.server.datanode.DataStorage.recoverTransitionRead(DataStorage.java:478)
        at org.apache.hadoop.hdfs.server.datanode.DataNode.initStorage(DataNode.java:1397)
        at org.apache.hadoop.hdfs.server.datanode.DataNode.initBlockPool(DataNode.java:1362)
        at org.apache.hadoop.hdfs.server.datanode.BPOfferService.verifyAndSetNamespaceInfo(BPOfferService.java:317)
        at org.apache.hadoop.hdfs.server.datanode.BPServiceActor.connectToNNAndHandshake(BPServiceActor.java:227)
        at org.apache.hadoop.hdfs.server.datanode.BPServiceActor.run(BPServiceActor.java:839)
        at java.lang.Thread.run(Thread.java:745)
2015-05-23 20:54:12,476 WARN org.apache.hadoop.hdfs.server.common.Storage: Failed to add storage for block pool: BP-2033573672-130.226.238.178-1367832131535 : Cannot create directory /mnt/disk_m/dfs/dn/current/BP-2033573672-130.226.238.178-1367832131535/current/finalized/subdir91/subdir168

The somewhat misleading "Cannot create directory" is not a file permission problem but rather a disk full problem. During this block pool upgrade some temporary space is needed for rewriting metadata, and that space is apparently more than the 10G that was available to "non-HDFS" (which we've concluded means "not HDFS storage files, but everything else is fair game"). Because some space is available to start the upgrade, it begins, but then when it exhausts the disk it fails, and This Kills The DataNode. It does clean up after itself, but prevents the DataNode from starting, meaning our cluster was on its knees and in no danger of standing up.

So the problem was lack of free space, which on 10 of our 12 machines we were able to solve by wiping temporary files from the colocated yarn directory. Those 10 machines were then able to upgrade their disk_m and started up. We still had two nodes down and unfortunately they were in different racks, so that meant we had a big pile of our replication factor 2 files missing blocks (the default HDFS block replication policy places the second and subsequent copies on a different rack from the first copy).

While digging around in the different properties that we thought could affect our disks and HDFS behaviour we were also restarting the failing DataNodes regularly. At some point the log message changed to:

WARN org.apache.hadoop.hdfs.server.common.Storage: java.io.FileNotFoundException: /mnt/disk_m/dfs/dn/in_use.lock (No space left on device)

After that message the DataNode started, but with disk_m marked as a failed volume. We're not sure why this happened but presume that after one of our failures it didn't clean up it's temp files on disk_m and then on subsequent restarts found the disk completely full and (rightly) considered it unusable and tried to carry on. With the final two DataNodes up we had almost all of our cluster, minus the two failed volumes. There were only 35 corrupted files (missing blocks) left after they came up. These were files set to replication factor 2, and by bad luck had both copies of some of their blocks on the failed disk_m (one from rack1, one from rack2).

It would not have been the end of the world to just delete the corrupted user downloads (they were all over a year old) but on principle, it would not be The Right Thing To Do.

On inodes and hardlinks

The normal directory structure of the dfs dir in a DataNode is /dfs/dn/current/<blockpool name>/current/finalized and within finalized are a whole series of directories to fan out the various blocks that the volume contains. During the block pool upgrade a copy of 'finalized' is made called previous.tmp. It's not a normal copy however - it uses hardlinks in order to avoid duplicating all of the data (which obviously wouldn't work). The copy is needed during the upgrade and is removed afterwards. Since our upgrade failed halfway through we had both directories and had no choice but to move the entire /dfs directory off of /disk_m to a temporary disk and complete the upgrade there. We first tried a copy (use cp -a to preserve hardlinks) to a mounted NFS share. The copy looked fine but on startup the DataNode didn't understand the mounted drive ("drive not formatted"). Then we tried copying to a USB drive plugged into the machine and that ultimately worked (despite feeling decidedly un-Yahoo). Once the USB drive was upgraded and online in the cluster, replication took over and copied all of its blocks to new homes on /rack2. We then unmounted the USB drive, wiped both /disk_m's and then let replication balance out again. Final result: no lost blocks.

Mitigation

With the cluster happy again we made a few changes to hopefully ensure this doesn't happen again:
  • dfs.datanode.du.reserved:25GB this guarantees 25GB free on each volume (up from 10GB) and should be enough to allow a future upgrade to happen
  • dfs.datanode.fsdataset.volume.choosing.policy:AvailableSpace 
  • dfs.datanode.available-space-volume-choosing-policy.balanced-space-preference-fraction:1.0 together these two direct new blocks to disks that have more free space, thereby leaving our now full /disk_m alone

Conclusion

This was one small taste of what can go wrong with filling heterogenous disks in an HDFS cluster. We're sure there are worse dangers lurking on the full-disk horizon, so hopefully you've learned from our pain and will give yourself some breathing room when things start to fill up. Also, don't use a replication factor of less than 3 if there's anyway you can help it.



Wednesday, 26 November 2014

Upgrading our cluster from CDH4 to CDH5

A little over a year ago we wrote about upgrading from CDH3 to CDH4 and now the time had come to upgrade from CDH4 to CDH5. The short version: upgrading the cluster itself was easy, but getting our applications to work with the new classpaths, especially MapReduce v2 (YARN), was painful.

The Cluster

Our cluster has grown since the last upgrade (now 12 slaves and 3 masters), and we no longer had the luxury of splitting the machines to build a new cluster from scratch. So this was an in-place upgrade, using CDH Manager.

Upgrade CDH Manager

The first step was upgrading to CDH Manager 5.2 (from our existing 4.8). The Cloudera documentation is excellent so I don't need to repeat it here. What we did find was that the management service now requests significantly more RAM for it's monitoring services (minimum "happy" config of 14GB), to the point where our existing masters were overwhelmed. As a stop gap we've added a 4th old machine to the "masters" group, used exclusively for the management service. In the longer term we'll replace the 4 masters with 3 new machines that have enough resources. 

Upgrade Cluster Members

Again the Cloudera documentation is excellent but I'll just add a bit. The upgrade process will now ask if a JAVA jdk should be installed (an improvement over the old behaviour of just installing one anyway). That means we could finally remove the Oracle JDK 6 rpms that have been lying around on the machines. For some reason the Host Inspector still complains about OpenJDK 7 vs Oracle 7 but we've happily been running on OpenJDK 7 since early 2014, and so far so good with CDH5 as well. After the upgrade wizard finished we had to tweak memory settings throughout the cluster, including setting the "Memory Overcommit Validation Threshold" to 0.99, up from its (very conservative) default of 0.8. Cloudera has another nice blog post on figuring out memory settings for YARN. Additionally Hue's configuration required some attention because after the upgrade it had forgotten where Zookeeper and the HBase Thrift server were. All in all quite painless.

The Gotchas

Getting our software to work with CDH5 was definitely not painless. All of our problems stemmed from conflicting versions of jars, due either to changes in CDH dependencies, or in changes to how a user classpath is specified as having priority over that of Yarn/HBase/Oozie. Additionally it took some time to wrap our heads around the new artifact packaging used by YARN and HBase. Note that we also use Maven for dependency management.

Guava
We're not alone in our suffering at the hands of mismatched Guava versions (e.g. HADOOP-10101HDFS-7040), but suffer we did. We resorted to specifying version 14.0.1 in any of our code that touches Hadoop and more importantly HBase, and exclude any higher version guavas from our dependencies. This meant downgrading some actual code that was using guava 15, but was the easiest path to getting a working system.

Jackson
We have many dependencies on Jackson 1.9 and 2+ throughout our code, so downgrading to match HBase's shipped 1.8.8 was not an option. It meant figuring out the classpath precedence rules described below, and solving the problems (like logging) that doing so introduced.

Logging
Logging in Java is a horrible mess, and with the number of intermingled projects required to make application software run on a Hadoop/HBase cluster it's not surprise that getting logging to work was brutal. We code to the SLF4J API and use Logback as our implementation of choice. The Hadoop world uses a mix of Java Commons Logging, java.util.logging, and log4j. We thought that meant we'd be clear if we used the same SLF4J API (1.7.5) and used the bridges (log4j-over-slf4j, jcl-over-slf4j, and jul-to-slf4j), which has worked for us up to now. <montage>Angry men smash things angrily over the course of days</montage> Turns out, there's a bug in the 1.7.5 implementation of log4j-over-slf4j, which blows up as we described over at YARN-2875. Short version - use 1.7.6+ in client code that attempts to use YARN and log4j-over-slf4j.

YARN
The crux of our problems was having our classpath loaded after the Hadoop classpath had been loaded, meaning old versions of our dependencies were loaded first. The new, surprisingly hard to find parameter that tells YARN to load your classpath first is "mapreduce.job.user.classpath.first". YARN also quizzically claims that the parameter is deprecated, but.. works for me.

Oozie
Convincing Oozie to load our classpath involved another montage of angry faces. It uses the same parameter as YARN, but with a prefix, so what you want is "oozie.launcher.mapreduce.job.user.classpath.first". We had been loading the old parameter "mapreduce.task.classpath.user.precedence" in each action in the workflow using the <job-xml> tag to load the configs from a file called hive-default.xml. We then encountered two problems: 
  1. Note the name - we used hive-default.xml instead of hive-site.xml because of a bug in Oozie (discussed here and here). That was fixed in the CDH5.2 Oozie, but we didn't get the memo. Now the file is called hive-site.xml and contains our specific configs and is again being picked up. BUT:
  2. Adding oozie.launcher.mapreduce.job.user.classpath.first to hive-site.xml doesn't work! As we wrote up in Oozie bug OOZIE-2066 this parameter has to be specified for each action, at the action level, in the workflow.xml. Repeating the example workaround from the bug report:
 <action name="run-test">  
  <java>  
   <job-tracker>c1n2.gbif.org:8032</job-tracker>  
   <name-node>hdfs://c1n1.gbif.org:8020</name-node>  
   <configuration>  
    <property>  
     <name>oozie.launcher.mapreduce.task.classpath.user.precedence</name>  
     <value>true</value>  
    </property>  
   </configuration>  
   <main-class>test.CPTest</main-class>  
  </java>  
  <ok to="end" />  
  <error to="kill" />  
 </action>  


New Packaging Woes


We build our jars using a combination of jar-with-dependencies and the shade plugin, but in both cases it means all our dependencies are built in. The problems come when a downstream, transitive dependency loads a different (typically older) version of one of the jars we've bundled in our main jar. This happens a lot with the Hadoop and HBase artifacts, especially when it comes to MR1 and logging.

Example exclusions

hbase-server (needed to run MapReduce over HBase): https://github.com/gbif/datacube/blob/master/pom.xml#L268

hbase-testing-util (needed to run mini clusters): https://github.com/gbif/datacube/blob/master/pom.xml#L302

hbase-client: https://github.com/gbif/metrics/blob/master/pom.xml#L226

hadoop-client (removing logging): https://github.com/gbif/metrics/blob/master/pom.xml#L327


Beyond just sorting conflicting dependencies, we also encountered a problem that presented as "No FileSystem for scheme: file". It turns out we had projects bringing in both hadoop-common and hadoop-hdfs, and so we were getting only one of the META-INF/services files in the final jar.  Thus we could not use the FileSystem to read local files (like jars for the class path) and also from HDFS.  The fix was to include the org.apache.hadoop.fs.FileSystem in our project explicitly: https://github.com/gbif/metrics/blob/master/cube/src/main/resources/META-INF/services/org.apache.hadoop.fs.FileSystem

Finally we had to stop the TableMapReduceUtil from bringing in it’s own dependent jars, which brought in yet more conflicting jars - this appears to be a change in the default behaviour, where dependent jars are now being brought in by default in the shorter versions of initTableMapper:
https://github.com/gbif/metrics/blob/master/cube/src/main/java/org/gbif/metrics/cube/occurrence/backfill/BackfillCallback.java#L37

Conclusion

As you can see the client side of the upgrade was beset on all sides by the iniquities of jars, packaging and old dependencies. It seems strange that upgrading Guava is considered a no-no, major breaking change by these projects, yet discussions about removing HBaseTablePool are proceeding apace and will definitely break many projects (including any of ours that touch HBase). While we're ultimately pleased that everything now works, and looking forward to benefiting from the performance improvements and new features of CDH5, it wasn't a great trip. Hopefully our experience will help others migrate more smoothly.

Tuesday, 4 March 2014

Lots of columns with Hive and HBase

We're in the process of rolling out a long awaited feature here at GBIF, namely the indexing of more fields from Darwin Core. Until the launch of our now HBase-backed occurrence store (in the fall of 2013) we couldn't index more than about 30 or so terms from Darwin Core because we were limited by our MySQL schema. Now that we have HBase we can add as many columns as we like!

Or so we thought.

Our occurrence download service gets a lot of use and naturally we want downloaders to have access to all of the newly indexed fields. The way our downloads work is as an Oozie workflow that executes a Hive query of an HDFS table (more details in this Cloudera blog). We use an HDFS table to significantly speed up the scan speed of the query - using an HBase backed Hive table takes something like 4-5x as long. But to generated that HDFS table we need to start from a Hive table that _is_ backed by HBase.

Here's an example of how to write a Hive table definition for an HBase-backed table:

CREATE EXTERNAL TABLE tiny_hive_example (
  key INT,
  kingdom STRING,
  kingdomkey INT
)
STORED BY 'org.apache.hadoop.hive.hbase.HBaseStorageHandler'
WITH SERDEPROPERTIES ("hbase.columns.mapping" = ":key#b,o:kingdom#s,o:kingdomKey#b")
TBLPROPERTIES(
  "hbase.table.name" = "tiny_hbase_table",
  "hbase.table.default.storage.type" = "binary"
);

But now that we have something like 600 columns to map to HBase, and that we've chosen to name our HBase columns just like the DwC Terms they represent (e.g. the basis of record term's column name is basisOfRecord) we have a very long "SERDEPROPERTIES" string in our Hive table definition. How long? Well, way more than the 4000 character limit of Hive. For our Hive metastore we use PostgreSQL and when Hive creates the SERDE_PARAMS table it gives the PARAM_VALUE column a datatype of VARCHAR(4000). Because 4k should be enough for anyone, right? Sigh.

The solution:

alter table "SERDE_PARAMS" alter column "PARAM_VALUE" type text;

We did lots of testing to make sure the existing definitions didn't get nuked by this change, and can confirm that the Hive code is not checking that 4000 value either (value is turned into a String: the source). Our new super-wide downloads table works, and will be in production soon!

Tuesday, 14 May 2013

Migrating our hadoop cluster from CDH3 to CDH4

We've written a number of times on the initial setup, eventual upgrade and continued tuning of our hadoop cluster. Our latest project has been upgrading from CDH3u3 to CDH4.2.1. Upgrades are almost always disruptive, but we decided it was worth the hassle for a number of reasons:

  • general performance improvements in the entire Hadoop/HBase stack
  • continued support from the community/user list (a non-trivial concern - anybody asking questions on the user groups and mailing list about problems with older clusters are invariably asked to update before people are interested in tackling the problem)
  • multi-threaded compactions (the need for which we concluded in this post)
  • table-based region balancing (rather than just cluster-wide)
We had been managing our cluster primarily using Puppet, with all the knowledge of how the bits worked together firmly within our dev team. In an effort to make everyone's lives easier, reduce our bus factor, and get the server management back into the hands of our ops team, we've moved to CDH Manager to control our CDH installation. That's been going pretty well so far, but, we're getting ahead of ourselves...

The Process

We have 6 slave nodes that have a lot of disk capacity since we spec'd with a goal of lots of spindles which meant we got lots of space "for free". Rather than upgrading in place, we decided to start fresh with new master & zookeeper nodes, and we calculated that we'd have enough space to pull half the slaves into the new cluster without losing any data. We cleaned up all the tmp files and anything we deemed not worth saving from HBase and hdfs, and started the migration:

Reduce the replication factor

We reduced the replication factor to 2 on the 6 slave nodes to reduce the disk use:

hadoop fs -setrep -R 2 /

Decommission the 3 nodes to move

"Decommissioning" is the civilized and safe way to remove nodes from a cluster where there's risk that they contain the only copies of some data in the cluster (they'll block writes but accept reads until all blocks have finished replicating out). To do it add the names of the target machines to an "excludes" file (one per line) that your hdfs config needs to reference, and then refresh hdfs.

The block in hdfs-site.xml:

<property>
  <name>dfs.hosts.exclude</name>
  <value>/etc/hadoop/conf/excluded_hosts</value>
</property>

then run:

bin/hadoop dfsadmin -refreshNodes

and wait for the "under replicated blocks" count on the hdfs admin page to drop to 0 and the decommissioning nodes to move into state "Decommissioned".

Don't forget HBase

The hdfs datanodes are tidied up now but don't forget to cleanly shutdown the HBase regionservers - run:

./bin/graceful_stop.sh HOSTNAME

from within the HBase directory on the host you're shutting down (specifying the real name for HOSTNAME). It will shed its regions and shutdown when tidied up (more details here).

Now you can shutdown the tasktracker and datanode, and then the machine is ready to be wiped.

Build the new cluster

We wiped the 3 decommissioned slave nodes and installed the latest version of CentOS (our linux of choice, version 6.4 at time of writing). We also pulled 3 much lesser machines from our other cluster after decommissioning them in the same way, and installed CentOS 6.4 there, too. The 3 lesser machines would form our zookeeper ensemble and master nodes in the new cluster.

Enter CDH Manager

The folks at Cloudera have made a free version of their CDH Manager app available, and it makes managing a cluster much, much easier. After setting up the 6 machines that would form the basis of our new cluster with just the barebones OS, we were ready to start wielding the manager. We made a small VM to hold the manager app and installed it there. The manager instructions are pretty good, so I won't recreate them here. We had trouble with the key-based install so had to resort to setting identical passwords for root and allowing root ssh access for the duration of the install, but other than that it all went pretty smoothly. We installed in the following configuration (the master machines are the lesser ones described above, and the slaves the more powerful machines).


Machine and Role assignments
Machine Roles
master1 HDFS Primary NameNode, Zookeeper Member, HBase Master (secondary)
master2 HDFS Secondary NameNode, Zookeeper Member, HBase Master (primary)
master3 Hadoop JobTracker, Zookeeper Member, HBase Master (secondary)
slave1 HDFS DataNode, Hadoop TaskTracker, HBase Regionserver
slave2 HDFS DataNode, Hadoop TaskTracker, HBase Regionserver
slave3 HDFS DataNode, Hadoop TaskTracker, HBase Regionserver

Copy the data

Now we had two running clusters - our old CDH3u3 cluster (with half its machines removed) and the new, empty CDH 4.2.1 cluster. The trick was how to get data from the old cluster into the new, with our primary concern being the data in HBase. The builtin facility for this sort of thing is called CopyTable, and sounds great, except that it doesn't work across major versions of HBase, so that was out. Next we looked at copying the HFiles directly from the old cluster to the new using the HDFS builtin command distcp. Because we could handle shutting down HBase on the old cluster for the duration of the copy this, in theory, should work - newer versions of HBase can read the older versions' HFiles and then write the new versions during compactions (and by shutting down we don't run the risk of missing updates from caches that haven't flushed, etc). And in spite of lots of warnings around the net that it wouldn't work, we tried it anyway. And it didn't work :) We managed to get the -ROOT- table up but it couldn't find .META. and that's where our patience ended. The next, and thankfully successful, attempt was using HBase export, distcp, and HBase import.

On the old cluster we ran:

bin/hadoop jar hbase-0.90.4-cdh3u3.jar export table_name /exports/table_name

for each of our tables, which produced a bunch of sequence files in the old cluster's HDFS. Those we copied over to the new cluster using HDFS's distcp command:

bin/hadoop distcp hftp://old-cluster-namenode:50070/exports/table_name hdfs://master1:8020/imports/table_name

which takes advantage of the builtin http-like interface (hftp) that HDFS provides, which makes the copy process version agnostic.

Finally on the new cluster we can import the copied sequence files into the new HBase:

bin/hadoop jar hbase-0.94.2-cdh4.2.1-security.jar import table_name /imports/table_name

Make sure the table exists before you import, and because the import is a mapreduce job that does Puts, it would also be wise to presplit any large tables at creation time so that you don't crush your new cluster with lots of hot regions and splitting. Also one known issue in this version of HBase is a performance regression from version 0.92 to 0.94 (detailed in HBASE-7868), which you can workaround by adding the following to your table definition:

DATA_BLOCK_ENCODING => 'FAST_DIFF'

e.g. create 'test_table', {NAME=>'cf', COMPRESSION=>'SNAPPY', VERSIONS=>1, DATA_BLOCK_ENCODING => 'FAST_DIFF'}

As per that linked issue, you should also enable short-circuit reads from the CDH Manager interface.

And to complete the copying process, run major compactions on all your tables to ensure the best data locality you can for your regionservers.

All systems go

After running checks on the copied data, and updating our software to talk to CDH4, we were happy that our new cluster was behaving as expected. To get back to our normal performance levels we then shutdown the remaining machines in the CDH3u3 cluster, wiped and installed the latest OS, and then told CDH Manager to install on them. A few minutes later we had all our M/R slots back, as well as our regionservers. We ran the HBase balancer to evenly spread out the regions, ran another major compaction on our tables to force data-locality, and we were back in business!


Wednesday, 11 July 2012

Optimizing Writes in HBase

I've written a few times about our work to improve the scanning performance of our cluster (parts 1, 2, and 3) since our highest priority for HBase is being able to serve requests for downloads of occurrence records (which require a full table scan). But now that the scanning is working nicely we need to start writing new records into our occurrence table as well as cleaning raw data and interpreting it into something more useful for the users of our data portal. That processing is built as Hive queries that read from and write back to the same HBase table. And while it was working fine on small test datasets, it all blew up once I moved the process to the full dataset. Here's what happened and how we fixed it. Note that we're using CDH3u3, with the addition of Hive 0.9.0, which we patched to support HBase 0.90.4.

The problem

Our processing is Hive queries which run as Hadoop MapReduce jobs. When the mappers were running they would eventually fail (repeatedly, ultimately killing the job) with an error that looks like this:

java.io.IOException: org.apache.hadoop.hbase.client.ScannerTimeoutException: 63882ms passed since the last invocation, timeout is currently set to 60000

We did some digging and found that this exception happens when the scanner's next() method hasn't been called within the timeout limit. We simplified our test case by reproducing this same error when doing a simple CopyTable operation (the one that ships with HBase), and again using Hive to do select overwrite table A select * from table B. In both cases mappers are assigned a split to scan based on TableInputFormat (just like our Hive jobs), and as they scan they simply put the record out to the new table. Something is holding up the loop as it tries to put, preventing it from calling next(), and thereby triggering the timeout exception.

The logs

First stop - the logs. The regionservers are littered with lines like the following:

WARN org.apache.hadoop.hbase.regionserver.MemStoreFlusher: Region occurrence,\x17\xF1o\x9C,1340981109494.ecb85155563c6614e5448c7d700b909e. has too many store files; delaying flush up to 90000ms
INFO org.apache.hadoop.hbase.regionserver.HRegion: Blocking updates for 'IPC Server handler 7 on 60020' on region occurrence,\x17\xF1o\x9C,1340981109494.ecb85155563c6614e5448c7d700b909e.: memstore size 128.2m is >= than blocking 128.0m size

Well, blocking updates sure sounds like the kind of thing that would prevent a loop from writing more puts and dutifully calling next(). After a little more digging (and testing with a variety of hbase.client.scanner.caching values, including 1) we concluded that yes, this was the problem, but why was it happening?

Why it blocks

It blocks because the memstore has hit what I'll call the "memstore blocking limit" which is controlled by the setting hbase.hregion.memstore.flush.size * hbase.hregion.memstore.block.multiplier, which by default are 64MB and 2 respectively. Normally the memstore should flush when it reaches the flush.size, but in this case it reaches 128MB because it's not allowed to flush due to too many store files (the first log line). The definition of "too many storefiles" is in turn a setting, namely hbase.hstore.blockingStoreFiles (default 7). A new store file is created every time the memstore flushes, and their number is reduced by compacting them into fewer, bigger storefiles during minor and major compactions. By default, compactions will only start if there are at least hbase.hstore.compactionThreshold (default 3) store files, and won't compact more than hbase.hstore.compaction.max (default 7) in a single compaction. And regardless of what you set flush.size to, the memstore will always flush if all memstores in the regionserver combined are using too much heap.  The acceptable levels of heap usage are defined by hbase.regionserver.global.memstore.lowerLimit (default 0.35) and hbase.regionserver.global.memstore.upperLimit (default 0.4). There is a thread dedicated to flushing that wakes up regularly and checks these limits:

  • if the flush thread wakes up and memstores are greater than the lower limit it will start flushing (starting with current biggest memstore) until it gets below the limit.
  • if flush thread wakes up and memstores are greater than the upper limit it will block updates and start flushing until it gets under lower limit, when it unblocks updates.
Fortunately we didn't see blocking because of the upper heap limit - only the "memstore blocking limit" described earlier. But at this point we only knew the different dials we could turn.

Stopping the blocking

Our goal is to stop the blocking so that our mapper doesn't timeout, while at the same time not running out of memory on the regionserver. The most obvious problem is that we have too many storefiles, which appears to be a combination of producing too many of them and not compacting them fast enough. Note that we have a 6GB heap dedicated to HBase, but can't afford to take any more away from the co-resident Hadoop mappers and reducers.

We started by upping the memstore flush size - this will produce fewer but bigger storefiles on each flush:
  • first we tried 128MB with block multiplier still at 2. This still produced too many storefiles and caused the same blocking (maybe a little better than at 64MB)
  • then tried 256MB with multiplier of 4.  The logs and ganglia showed that the flushes were happening well before 256MB (still around 130MB) "due to global heap pressure" - a sign that total memstores were consuming too much heap. This meant we were still generating too many files and got the same blocking problem, but with the "memstore blocking limit" set to 1GB the memstore blocking happened much less often, and later in the process (still killed the mappers though)
We were now producing fewer storefiles, but they were still accumulating too quickly. From ganglia we also saw that the compaction queue and storefile counts were growing unbounded, which meant we'd hit the blocking limit again eventually. Next came trying to compact more files per compaction, hence raised compaction.max to 20, and this made little difference.

So how to reduce the number of storefiles? If we had fewer stores, we'd be creating fewer files and using up less heap for memstore, so next we increased the region size.  This meant increasing the setting hbase.hregion.max.filesize from its default of 256MB to 1.5G, and then rebuilding our table with fewer pre-split regions.  That resulted in about 75% fewer regions.

It was starting to look good - the number of "Blocking updates" log messages dropped to a handful per run, but it was still enough to affect one or two jobs to the point of them getting killed.  We tried upping the memstore.lowerLimit and upperLimit to 0.45 and 0.5 respectively, but again no joy.

Now what?

Things looked kind of grim. After endless poring over ganglia charts, we kept coming back to one unexplained blip that seemed to coincide with the start of the storefile explosion that eventually killed the jobs.
Figure 1: Average memstore flush size over time
At about the halfway point of the jobs the size of memstore flushes would spike and then gradually increase until the job died. Keep in mind that the chart shows averages, and it only took a few of those flushes to wait for storefiles long enough to fill to 1GB and then start the blocking that was our undoing. Back to the logs.

From the start of Figure 1 we can see that things appear to be going smoothly - the memstores are flushing at or just above 256MB, which means they have enough heap and are doing their jobs. From the logs we see the flushes happening fine, but there are regular lines like the following:
INFO org.apache.hadoop.hbase.regionserver.MemStoreFlusher: Under global heap pressure: Region uat_occurrence,\x06\x0E\xAC\x0F,1341574060728.ab7fed6ea92842941f97cb9384ec3d4b. has too many store files, but is 625.1m vs best flushable region's 278.2m. Choosing the bigger.
This isn't quite as bad as the "delaying flush" line, but it shows that we're on the limit of what our heap can handle. Then starting from around 12:20 we see more and more like the following:
WARN org.apache.hadoop.hbase.regionserver.MemStoreFlusher: Region uat_occurrence,"\x98=\x1C,1341567129447.a3a6557c609ad7fc38815fdcedca6c26. has too many store files; delaying flush up to 90000ms
and then to top it off:
INFO org.apache.hadoop.hbase.regionserver.wal.HLog: Too many hlogs: logs=35, maxlogs=32; forcing flush of 1 regions(s): ab7fed6ea92842941f97cb9384ec3d4b
INFO org.apache.hadoop.hbase.regionserver.MemStoreFlusher: Flush thread woke up with memory above low water.
So what we have is memstores initially being forced to flush because of minor heap pressure (adds storefiles faster than we can compact). Then we have memstores delaying flushes because of too many storefiles (memstores start getting bigger - our graph spike). Then the write ahead log (WAL) complains about too many of its logs, which forces a memstore flush (so that the WAL HLog can be safely discarded - this again adds storefiles).  And for good measure the flushing thread now wakes up, finds its out of heap, and starts attempting flushes, which just aggravates the problem (adding more storefiles to the pile). The failure doesn't happen immediately but we're past the point of no return - by about 13:00 the memstores are getting to the "memstore blocking limit" and our mappers die.

What's left?


Knowing what's going on in the memstore flush size analysis is comforting, but just reinforces what we already knew - the problem is too many storefiles. So what's left?  Raising the max number of storefiles, that's what! Every storefile in a store consumes resources (file handles, xceivers, heap for holding metadata), which is why it's limited to a maximum of a very modest 7 files by default. But for us this level of write load is rare - in normal operations we won't hit anything like this, and having the capacity to write a whole bunch of storefiles over short-ish, infrequent bursts is relatively safe, since we know our nightly major compaction will clean them up again (and thereby free up all those extra resources). Crank that maximum up to 200 and, finally, the process works!

Conclusion

Our problem was that our compactions couldn't keep up with all the storefiles we were creating. We tried turning all the different HBase dials to get the storefile/compaction process to work "like they're supposed to", but in the end the key for us was the hbase.hstore.blockingStoreFiles parameter which we set to 200, which is probably double what we actually needed but gives us buffer for our infrequent, larger write jobs. We additionally settled on larger (and therefore fewer) regions, and a somewhat bigger than default memstore. Here are the relevant pieces of our hbase-site.xml after all our testing:

  <!-- default is 256MB 268435456, this is 1.5GB -->
  <property>
    <name>hbase.hregion.max.filesize</name>
    <value>1610612736</value>
  </property>
  
  <!-- default is 2 -->
  <property>
    <name>hbase.hregion.memstore.block.multiplier</name>
    <value>4</value>
  </property>
  
  <!-- default is 64MB 67108864 -->
  <property>
    <name>hbase.hregion.memstore.flush.size</name>
    <value>134217728</value>
  </property>
  
  <!-- default is 7, should be at least 2x compactionThreshold -->
  <property>
    <name>hbase.hstore.blockingStoreFiles</name>
    <value>200</value>
  </property>

And finally, if our compactions were faster and/or more frequent, we might be able to keep up with our storefile creation. That doesn't look possible without multi-threaded compactions, but naturally those exist in newer versions of HBase (starting with 0.92 - HBASE-1476) so if you're having these problems, an upgrade might be in order. Indeed this is prompting us to consider an upgrade to CDH4.

Many thanks to Lars George, who helped us get through the "Now What?" phase by digging deep into the logs and the source to help us work out what was going on.

Friday, 8 June 2012

Faster HBase - hardware matters

As I've written earlier, I've been spending some time evaluating the performance of HBase using PerformanceEvaluation. My earlier conclusions amounted to: bond your network ports and get more disks. So I'm happy to report that we got more disks, in the form of 6 new machines that together make up our new cluster:

Master (c1n4): HDFS NameNode, Hadoop JobTracker, HBase Master, and Zookeeper
Zookeeper (c1n1): Zookeeper for this cluster, master for our other cluster

Slaves (c4n1..c4n6): HDFS DataNode, Hadoop TaskTracker, HBase RegionServer (6 GB heap)

Hardware:
c1n*: 1x Intel Xeon X3363 @ 2.83GHz (quad), 8GB RAM, 2x500G SATA 5.4K
c4n*: Dell R720XD, 2x Intel Xeon E5-2640 @ 2.50GHz (6-core), 64GB RAM, 12x1TB SATA 7.2K


Obviously the new machines come with faster everything and lots more RAM, so first I bonded two ethernet ports and then ran the tests again to see how much we had improved:
Figure 1: Scan performance of new cluster (2x 1gig ethernet)
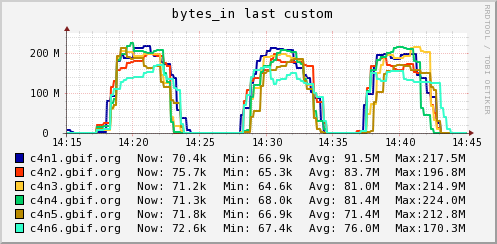
So, 1 million records/second? Yes, please! That's a performance increase of about 300% over the c2 cluster I tested in my previous posts. Given that we doubled the number of machines and quadrupled the number of drives, that improvement feels about right. But the decline in performance as number of mappers is increased is still a bit suspect - we'd hope that performance would go up with more workers. This is the same behaviour we saw when we were limited by network in our original tests, and ganglia again shows a similar pattern, though this time it looks like we're hitting a limit around the 2 gig ethernet bond:

Figure 2: bytes_in (MB/s) with dual gigabit ethernet
Figure 3: bytes_out (MB/s) with dual gigabit ethernet

Unfortunately our master switch is currently full, so we don't have the extra 6 ports needed to test a triple bond - but given our past experience I feel reasonably confident that it would change Figure 1 such that scan performance increases with number of mappers up to some disk I/O contention limit.

Hang-on, what about data locality?

But there's a bigger question here - why are we using so much network bandwidth in the first place? Why stress about major compactions and data locality when it doesn't seem to get used? Therein lies the rub - PerformanceEvaluation can't take advantage of data locality. Tim wrote about the tremendous importance of TableInputFormat in ensuring maximum scan performance from MapReduce, and PerformanceEvaluation doesn't do that. It assigns a block of ids to scan to different mappers at random, meaning that at best one in six mappers (in our setup) will coincidentally have local data to read, and the rest will all transfer their data across the network. This isn't a bug in PerformanceEvaluation, per se, because it was written to try and emulate the tests that Google ran in their seminal white paper on BigTable, rather than act as a true benchmark for scanning performance. But if you're new to this stuff (as I was) it sure can be confusing. When we switched to scanning our real data using TableInputFormat our throughput jumped to 2M/sec from the 1M/sec we got using PerformanceEvaluation.

Conclusions

While we learned a lot from using PerformanceEvaluation to test our clusters, and it helped to uncover any misconfigurations and taught us how to fine tune lots of parameters, it is not a good tool for benchmarking scan performance. As Tim wrote, scans across our real occurrence data (~370M records) using TableInputFormat are finishing in 3 minutes - for our needs that is excellent and means we're happy with our cluster upgrade. Stay tuned for news about the occurrence download service that Lars and I are writing to take advantage of all this speed :)

Tuesday, 20 March 2012

HBase Performance Evaluation continued - The Smoking Gun

Update: See also part 1 and part 3.

In my last post I described my initial foray into testing our HBase cluster performance using the PerformanceEvaluation class.  I wasn't happy with our conclusions, which could largely be summed up as "we're not sure what's wrong, but it seems slow".  So in the grand tradition of people with itches that wouldn't go away, I kept scratching.  Everything that follows is based on testing with PerformanceEvaluation (the jar patched as in the last post) using a 300M row table built with PerformanceEvaluation sequentialWrite 300, and tested with PerformanceEvaluation scan 300.  I ran the scan test 3 times, so you should see 3 distinct bursts of activity in the charts.  And to recap our hardware setup - we have 3 regionservers and a separate master.

The first unsettling ganglia metric that kept me digging was of ethernet bytes_in and bytes_out.  I'll recreate those here:
Figure 1 - bytes_in (MB/s) with single gigabit ethernet
Figure 2 - bytes_out (MB/s) with single gigabit ethernet
This is a single gigabit ethernet link, and that is borne out by the Max values, which are near the theoretical max of 120 megabytes per second (MB/s), and as you can see they certainly aren't sitting at 120 constantly in the way one would expect if ethernet was our bottleneck. But that bytes_in graph sure looks like it's hitting some kind of limit - steep ramp up, relatively constant transfer rate, then steep ramp down.  So I decided to try channel bonding to effectively use 2 gigabit links on each server "bonded" together.  It turns out that's not quite as trivial as it may seem, but in the end I got it working following the Dell/Cloudera configuration suggestion of mode 6 / balance-alb, which is described more in the Linux kernel bonding documentation. The results are shown in the following graphs:

Figure 3 - bytes_in (MB/s) with dual (bonded) gigabit ethernet
Figure 4 - bytes_out (MB/s) with dual (bonded) gigabit ethernet
Unfortunately the scale has changed (ganglia ain't perfect) but you can see we're now hovering a bit higher than the single ethernet case, and at some points swinging significantly above the single ethernet limit (a few gusts up to 150).  So it would seem that even though the single gigabit graphs didn't look like they were hitting theoretical maximum, they were definitely limited.  Not by much though - maybe 10-15%?  As they say, the proof is in the pudding, so what was the final throughput for the two tests?


EthernetThroughput (rows/s)
Single340k
Double357k

Looks like 5%. Certainly not the doubling I was hoping for! Something else must be the limiting factor then, but what?  Well, what does CPU say?
Figure 5 - cpu_idle with dual (bonded) gigabit ethernet
That CPU is saying, "Feed me Seymour!".  If the CPU is hungry, what about the load average?
Figure 6 - one minute load average with dual (bonded) gigabit ethernet
These machines have 8 hyper-threaded cores, so effectively 16 cpus. The load average looks like it's keeping the CPUs fed - hovering around 20. But hang on - the load average isn't all about CPU - it's about work that the whole machine needs to do - including all the io subsystems. So if it ain't network, and it ain't CPU then it's gotta be disks. Let's look at how much time the CPU spent waiting on io (which in this case basically means "waiting on disks"):
Figure 7 - percentage cpu spent in wait_io state, with dual (bonded) gigabit ethernet
From a pure gut perspective, that seems kind of high.  But on closer inspection, that graph also looks familiar - it's basically the same as Figure 6 - the load average. So what can we deduce?  When ethernet is removed as a limiting factor the run queue is filled with processes that all cause an increase in wait_io - which means our processes would all finish faster if they didn't have to wait for io.  The limiting factor must, then, be the disks.

Recap (TL;DR)
Ethernet looked suspiciously capped, but performance (and ethernet usage) only increased slightly when the cap was lifted. Closer inspection of the resulting load average and CPU usage showed that the limiting factor was in fact the disks.  

Solution?  Replacing the disks might help a little - they're 3 year old 2.5" SATA, but they are 7.2k rpm, and a more modern 10k 2.5" would be marginally faster.  The real benefit would probably be more disks - the current wisdom on the mailing lists and in the documentation is to maximize the ratio of disk spindles to cpu cores and I think that's borne out by these results.  In the coming weeks we're going to build a new cluster of 6 machines with 12 disks each and I very much look forward to testing my theories once they're up and running.  Stay tuned!

Tuesday, 28 February 2012

Performance Evaluation of HBase

Update: See also followup posts: part 2 and part 3.

In the last post Lars talked about setting up Ganglia for monitoring our Hadoop and HBase installations.  That was in preparation for giving HBase a solid testing run to assess its suitability for hosting our index of occurrence records.  One of the important features in our new Data Portal will be the "Download" function that lets people download occurrences matching some search criteria and currently that process is a very manual and labour intensive one, so automating it will be a big help to us.  Using HBase it would be implemented as a full table scan, and that's why I've spent some time testing our scan performance. Anyone who has been down this road will probably have encountered the myriad opinions on what will improve performance (some of them conflicting) along with the seemingly endless parameters that can be tuned in a given cluster.  The overall result of that kind of research is: "You gotta do it yourself".  So here we go.

Because we hope to get some feedback from the HBase community on our results (ideally comparisons to other running clusters) we decided to use the PerformanceEvaluation class that ships with HBase.  Unfortunately it's not completely bug free so I've had to patch it to work in the way we would like.  From a stock cdh3u3 HBase I patched HBASE-5401 and HBASE-4688, and had a good, hard think about HBASE-5402.  There are a bunch of things I learned about the PerformanceEvaluation (PE) class in the last few weeks, and the implications of 5402 are some of them.  If anyone's interested I'll blog about those another time, but for now suffice it to say that in my final suite of tests I went with writing tables using "sequentialWrite" (which obviates the difficulties in 5402) and doing scans with the "scan" test.

There are many variables that can be changed in an HBase/Hadoop cluster setup but you have to start somewhere so here's our basic config that remained unchanged throughout the test (you can see more at its ganglia page):

Master (c1n2): HDFS NameNode, Hadoop JobTracker, HBase Master, and Zookeeper
Slaves (c2n1, c2n2, c2n3): HDFS DataNode, Hadoop TaskTracker, HBase RegionServer (6 GB heap)

Hardware:
c1n2: 1x Intel(R) Xeon(R) X3363 @ 2.83GHz (quad), 8GB RAM, 2x500G SATA 5.4K
c2n*: 2x Intel(R) Xeon(R) E5630 @ 2.53GHz (quad), 24GB RAM, 6x250G SATA 7.2K

The parameters I varied are:
  • number of rows in the test table (50M, 100M, 200M)
  • number of mappers per server (8, 10, 12, 14, 20 - more than 20 and we ran out of RAM)
  • snappy compression (on/off)
  • scanner caching (size)
  • block caching (on/off)
Test Methodology

The test methodology was to start with an empty HDFS (replication factor of 2), an empty HBase and no other tasks running on the machines.  Then build a table using a command line like 

hbase org.apache.hadoop.hbase.PerformanceEvaluation sequentialWrite 100

and then wait for the split/compaction cycle to complete, and then run a major compaction to encourage data locality.  In tests using compression I would construct an empty table by hand, specifying compression=>'SNAPPY' for the info column family before running the sequentialWrite. I'd also wait for the region balancer to run, ensuring that all regionservers had an equal number of regions (+/- 1). Once that was complete I would run a scan test with a command like:

hbase org.apache.hadoop.hbase.PerformanceEvaluation scan 100

and note the real time taken as reported by the JobTracker as well as the total time spent in mappers as reported by PE itself.  I ran each scan test 3 times unless the first 2 tests were very close, in which case I sometimes skipped the 3rd run. Note also that PE uses 10 byte keys and 1000 kilobyte values by default. 

Two things were immediately obvious in my caching tests, which I'll talk about briefly before getting into the results proper.

Scanner Caching

The HBase API Scan class takes a setting called setCaching(int caching) which tells the scanner how many rows to fetch at a time from the server.  This defaults to 1, which is optimal for single gets, but is decidedly suboptimal for big scans like ours. Unfortunately PE doesn't allow for explicitly setting this value on the command line and so I took the advice of the API Javadoc and passed in a value of 1000 for the property hbase.client.scanner.caching in the hbase-site.xml file that forms the configuration for the MapReduce job that is PE.  It would seem, though, that this property is not being honoured by HBase and so my initial tests all ran with a cache size of 1, producing poor results.  I subsequently hard-coded the setCaching(1000) on the scans themselves in the PE and saw significant improvements. Those differences are visible in the results, below.

Block Caching

When I say block caching I mean HBase blocks - not HDFS blocks.  See the HBase guide or Lars George's excellent HBase: The Definitive Guide for many more details. You'll see many recommendations from different sources to turn block caching off during scans but it's not immediately obvious why that should be.  It turns out that it has no performance implications for the scan itself, but will significantly impact any random reads (gets) that may be relying on recently loaded blocks.  If the scan is using the block cache then it will load the cache with a block, read the block, and then load the next one, ignoring the first one for the rest of the scan.  The earlier loaded blocks will be evicted quickly (as new blocks are loaded) leading to "cache churn".  So I tested the block cache on and off and concluded that there was no difference in a dedicated scan test (no other activity in the cluster) and so for the rest of my tests I left the block cache on.  In order to test this behaviour I again had to hard-code PE with setCacheBlocks(false) (it defaults to true).

The Results

The full spreadsheet is available for download from our google code site.  I've just included the summary chart here, because it pretty much tells the story.  Of note: the y-axis is Records / second which I calculate as the total records scanned divided by the total time for the job as reported by the JobTracker.  This doesn't, therefore, take any of the PE generated per-mapper counts/times into account (which are still somewhat mysterious to me).


Conclusions (within our obviously limited test environment):

  • with bigger datasets, more mappers are better; with smaller datasets, somewhat fewer are better
  • compression slows things down.  This is probably the most surprising (and contentious) finding.  We would expect performance to improve with compression (at worst staying the same) because there is much less data to transfer when the files are compressed, and I/O is typically the limiting factor in HBase performance.  I kept an eye on the cpus with ganglia during the uncompressed tests and sure enough, they spent approximately double the amount of time in io_wait as in the compressed tests.
  • ganglia revealed no obvious bottlenecks during the scan.  You can look at our ganglia charts from the past few weeks and apart from a few purposefully degenerate tests there was no obvious component that was limiting things - cpus never went above 60% (io_wait never above 30%), and RAM and disks "looked ok".  If anyone has insight here we'd really appreciate it.
  • total variability across all these tests was only about 20%.  Either all tests are hitting the same, as yet unseen, hardware or configuration limit, or there really is no silver bullet to performance increases - tuning is an incremental thing.
  • there are still strange things going on :)  I can't explain the fact that in the compressed test performance increases from 50 to 100M records, and then decreases dramatically with 200M records.
We'd love feedback on these results, both in terms of how we can improve our testing and in interpreting the results, as well as any numbers you may have from your clusters when running PE.  Is 300k records per second even in the ballpark?  It's crazy that these data don't exist out there already, so hopefully this post helps alleviate that somewhat.  

The good news is that we'll be getting new cluster hardware soon, and then I think the next step is to load our real occurrences data into a table and run similar scanning tests against it to optimize those scans.  Of course then we'll start writing new records at the same time, and then things will get.... interesting.  Should be fun :)

Friday, 8 July 2011

Are you the keymaster?


As I mentioned previously I'm starting work on evaluating HBase for our occurrence record needs.  In the last little while that has meant coming up with a key structure and/or schema that optimizes reads for one major use case of the GBIF data portal - a user request to download an entire record set, including raw records as well as interpreted.  The most common form of this request looks like "Give me all records for ", eg "Give me all records for Family Felidae".

So far I'm concentrating more on the lookup and retrieval rather than writing or data storage optimization, so the schema I'm using is two column families, one for verbatim columns, one for interpreted (for a total of about 70 columns).  The question of which key to use for HTable's single indexed column is what we need to figure out.  For all these examples we assume we know the backbone taxonomy id of the taxon concept in question (ie Family Felidae is id 123456).

Option 1
Key: native record's unique id

Query style: The simplest way of finding all records that belong to Family Felidae is scan all of them, and check against the Family column from the interpreted column family.  The code looks like this:

    HTable table = new HTable(HBaseConfiguration.create(), tableName);
    byte[] cf = Bytes.toBytes(colFam);
    byte[] colName = Bytes.toBytes(col);
    byte[] value = Bytes.toBytes(val);

    Scan scan = new Scan();
    ResultScanner scanner = table.getScanner(scan);

    for (Result result : scanner) {
      byte[] testVal = result.getValue(cf, colName);
      if (Bytes.compareTo(testVal, value) == 0) doSomething;

    }

Because this means transferring all columns of every row to the client before checking if it's even a record we want, it's incredibly wasteful and therefore very slow.  It's a Bad Idea.

Option 2
Key: native record's unique id

Query style: HBase provides a SingleColumnValueFilter that executes our equality check on the server side, thereby saving the transfer of unwanted columns to the client.  Here's the code:

    HTable table = new HTable(HBaseConfiguration.create(), tableName);
    byte[] cf = Bytes.toBytes(colFam);
    byte[] colName = Bytes.toBytes(col);
    byte[] value = Bytes.toBytes(val);

    SingleColumnValueFilter valFilter = new SingleColumnValueFilter(cf, colName, CompareFilter.CompareOp.EQUAL, value);
    valFilter.setFilterIfMissing(true);

    Scan scan = new Scan();
    scan.setFilter(valFilter);
    ResultScanner scanner = table.getScanner(scan);


This is about as good as it gets until we start getting clever :)

Option 3
Key: concatentation of nub-taxonomy "left" with native record's unique id

Query style:  We know that a taxonomy is a tree, and our backbone taxonomy is a well behaved (ie true) tree.  We can use nested sets to make our "get all children of node x" query much faster, which Markus realized some time ago, and so thoughtfully included the left and right calculation as part of the backbone taxonomy creation.  Individual occurrences of the same taxon will share the same backbone taxonomy id, as well as the left and right.  One property of nested sets not mentioned in the wikipedia article is that when the records are ordered by their lefts, the query of "give me all records where left is between parent left and parent right" becomes "give me all rows starting with parent left and ending with parent right", which in HBase terms is much more efficient since we're doing a sequential read from disk without any seeking.  So we build the key as leftId_uniqueId, and query as follows (note that startRow is inclusive and stopRow is exclusive, and we want exclusive on both ends):


    HTable table = new HTable(HBaseConfiguration.create(), tableName);
    Scan scan = new Scan();
    scan.setStartRow(Bytes.toBytes((left + 1) + "_"));
    scan.setStopRow(Bytes.toBytes(right + "_"));

    ResultScanner scanner = table.getScanner(scan);

Which looks pretty good, and is in fact about 40% faster than Option 2 (on average - depends on the size of the query result).  But on closer inspection, there's a problem.  By concatenating the left and unique ids with an underscore as separator, we've created a String, and now HBase is doing its usual lexicographical ordering, which means our rows aren't ordered as we'd hoped.  For example, this is the ordering we expect:

1_1234
2_3458
3_3298
4_9378
5_3435
10_5439
100_9763

but because these are strings, HBase orders them as:

1_1234
10_5439
100_9763
2_3458
3_3298
4_9378
5_3435

There isn't much we can do here but filter on the client side.  For every key, we can extract the left portion, convert to a Long, and compare it to our range, discarding those that don't match.  It sounds ugly, and it is, but it doesn't add anything appreciable to the processing time, so it would work.

Except that there's a more fundamental problem - if we embed the left in our primary key, it only takes one node added to the backbone taxonomy to force an update in half of all the lefts (on average) which means all of our primary keys get rewritten.  At 300 million records and growing, that's not an option.

Option 4
Key: native record's unique id
Secondary index: left to list of unique ids

Query style: Following on from Option 3, we can build a second table that will serve as a secondary index.  We use the left as a numeric key (which gives us automatic, correct ordering) and write each corresponding unique occurrence id as a new column in the row.  Then we can do a proper range query on the lefts, and generate a distinct Get for each distinct id.  Unfortunately building that index is quite slow, and is still building as I write this, so I haven't been able to test the lookups yet. 

For those keeping score at home, I'm using Hbase 0.89 (from CDH3b4) which doesn't have built in secondary indexes (which 0.19 and 0.20 did).

I'll write more when I've learned more, and welcome any tips or suggestions you might have to aid in my quest!